How much do tech jobs pay? The honest answer
By the RoleMath Editorial Team · Last updated 2026-06-14. Every figure traces to a cited source; we sell none of the options discussed. Draft pending human review.
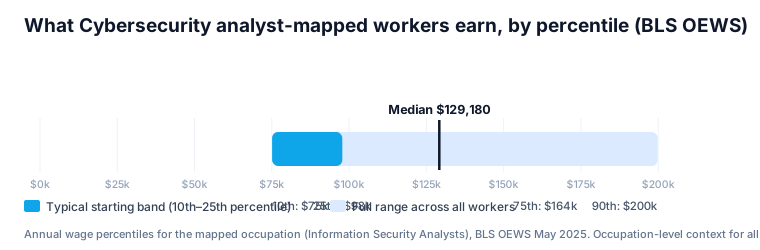
How much tech jobs pay depends on the role, your location, and your experience — but the widely-quoted single median (e.g., $129,180 for cybersecurity) is the all-worker midpoint, not a starting salary; a career changer should plan around the cited 10th–25th percentile band instead (BLS OEWS, May 2025). Almost every "tech salary" you'll see quoted is a single median number — and used the way sellers and listicles use it, that number is quietly misleading. The median is the midpoint of everyone in the occupation, including people with a decade of experience. A career changer doesn't start at the median; they start nearer the bottom of the range. We don't sell you a course, and our recommendations are never influenced by who pays us, so here is the honest, cited version, built straight from the government's own wage percentiles (BLS OEWS, May 2025).
Key takeaways
- The widely-quoted median is the all-worker midpoint, not a starting salary — career changers more often start nearer the 10th–25th percentile (a proxy, not a rule).
- For cybersecurity-mapped roles, the cited lower band (10th–25th) is $75,090–$97,810 vs. a $129,180 median (BLS OEWS, May 2025).
- Geography can move the number as much as your job title — IT support's median runs from $61,860 nationally to about $106,040 in the Sacramento metro.
- Every figure is occupation-level BLS context, not a certification outcome or personal guarantee; plan around the lower band, not the median.
The median is not your starting salary
When a page says cybersecurity "pays $129,180," that's the median (50th percentile) across all information-security workers nationally — early-career and veteran alike. A career changer is far more likely to start nearer the bottom of the distribution than at the median: for that same occupation, BLS puts the 10th percentile at $75,090 and the 25th at $97,810 — roughly $31,000 to $54,000 below the median. The chart above shows it: the dark band is roughly where many new entrants land, and the median line sits well to its right. (Important caveat below: these percentiles describe all current workers, not a literal entry-vs-veteran split.)
What the percentiles actually look like, role by role
Here is the cited distribution for the occupations our common entry roles map to (BLS OEWS national, May 2025). The "lower band" is the 10th–25th percentile; the median is the all-worker midpoint. One thing to understand first: these are cross-sectional wage percentiles across all current workers in the occupation, not a literal entry-vs-experienced split. We use the lower band as a proxy for early-career pay because new entrants tend to cluster there — but your prior background can place you higher or lower, so read it as a realistic planning range, not a rule.
| Role (mapped BLS occupation) | Lower band (10th–25th) | Median (all workers) | Experienced (90th) |
|---|---|---|---|
| Cybersecurity / SOC analyst (Information Security Analysts) | $75,090–$97,810 | $129,180 | $199,850 |
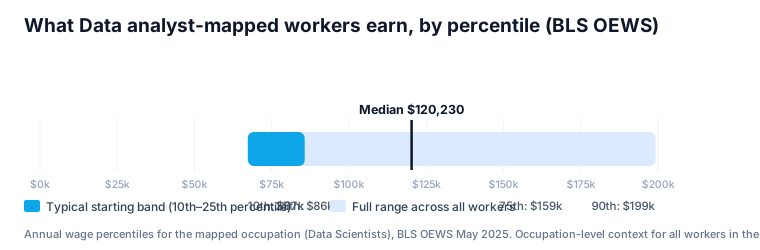
| Data / AI analyst (Data Scientists) | $67,240–$85,660 | $120,230 | $199,130 |
| Software developer (Software Developers) | $82,460–$105,210 | $135,980 | $214,670 |
| Cloud / network security (Computer Occupations, All Other) | $55,940–$79,370 | $116,580 | $188,470 |
| Network / systems admin (Network & Computer Systems Administrators) | $62,640–$78,010 | $99,130 | $155,050 |
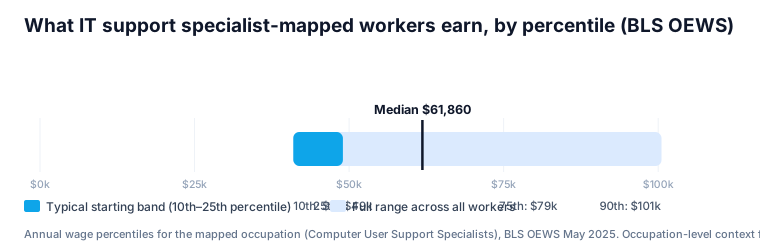
| IT support / help desk (Computer User Support Specialists) | $40,980–$49,000 | $61,860 | $100,540 |
| Project coordinator (Project Management Specialists) | $61,580–$78,440 | $102,320 | $167,970 |
Every figure is occupation-level BLS data for the broader occupation, not a personal or certification outcome. One mapping to watch: "data / AI analyst" here maps to the BLS Data Scientists occupation, which skews toward more senior, higher-paid work than a typical entry data-analyst job — treat that row as an upper-bound proxy.
Where you live can change the number as much as your title
Geography moves tech pay more than most people expect. Comparing like for like: IT support has a national median of $61,860, but in the Sacramento metro the median for that same occupation is about $106,040 — roughly a 70% difference for the same work, driven by location alone. Software developers run from a $135,980 national median to about $213,110 in San Jose. (Career stage moves it too: nationally that IT-support occupation starts as low as a $40,980 10th percentile — so where you are in the distribution and where you live each shift the number a lot.) Before you anchor on any single salary, check it for where you actually live — and weigh it against local cost of living, which those high-wage metros also carry.
Why sellers quote the median (and what to ask)
A bootcamp or course has every incentive to quote the median — or even the higher mean — and let you assume it's a starting salary. It isn't. When any source shows you a tech salary, ask three questions: Is this the median or an entry-level percentile? Is it for my location? And does it count people with years of experience? An honest answer usually makes the number smaller and more useful. The same skepticism applies to a school's outcomes report.
How to use these numbers honestly
Plan your career change around the 10th–25th percentile for your target role and location — that's the realistic early-career band — and treat the median as where you might get to with experience, not where you start. Factor in that pay and cost of living rise together in the top metros. And remember every figure here is occupation-level context from BLS, not a promise: what you personally earn depends on your employer, skills, location, and timing. Used that way, these cited percentiles are one of the most useful planning tools you have.
Frequently asked questions
Is the median tech salary what I'll earn starting out?
No. The median is the 50th percentile across all workers in the occupation, including experienced ones. As a career changer you should plan around the 10th–25th percentile — for many tech occupations that's tens of thousands of dollars below the median (BLS OEWS, May 2025).
How much do entry-level tech jobs pay?
It varies by role and location, but the realistic early-career band is roughly the 10th–25th percentile of the mapped occupation: about $41,000–$49,000 for IT support, $67,000–$86,000 for data roles, and $75,000–$98,000 for cybersecurity, per cited BLS OEWS data. These are occupation-level figures, not guarantees.
Do tech salaries really vary that much by location?
Yes — often more than by job title. The same occupation can have a national median of $61,860 (IT support) yet a metro median above $106,000 in a high-cost area like Sacramento. Always check the figure for your location, and weigh it against local cost of living.
Why do salary websites show different numbers?
Many sites use self-reported or modeled data without a clear methodology, and most quote a single median. We use BLS OEWS — the official government employer survey of wages — and show the full percentile range, including the lower band, so you can see what the median hides.
How much does a cybersecurity analyst make?
The mapped occupation (Information Security Analysts) has a national median of $129,180, but the cited 10th–25th percentile band is $75,090–$97,810 — a more realistic range for someone entering the field, with the caveat that these are all-worker percentiles, not a literal entry-level cut (BLS OEWS, May 2025). It's occupation-level context, not your guaranteed salary.
Related, with the cited detail
- Compare entry paths on cited pay and outlook
- The cited cybersecurity salary detail
- How to read a bootcamp outcomes report
- Compare every route into tech
- Ways to fund your path
- Start the RoleMath planner
Sources
Figures in this article trace to official sources — BLS OEWS (May 2025) and Employment Projections (2024–2034), O*NET, and OEM certification pages — named where they appear or on the cited page each links to. Charts are drawn from those cited BLS figures, with the source noted in each caption. This page stays draft_noindex pending human citation review.
Citation Ledger
| ID | Supports | Evidence | Source |
|---|---|---|---|
| CIT-01 | Visible figures and claims | Official sources (BLS OEWS May 2025; BLS Employment Projections 2024–2034; O*NET; OEM certification pages) | Named inline and on each linked cited page |