Tech salary by location: what the data actually shows
By the RoleMath Editorial Team · Last updated 2026-06-14. Every figure traces to a cited source; we sell none of the options discussed.
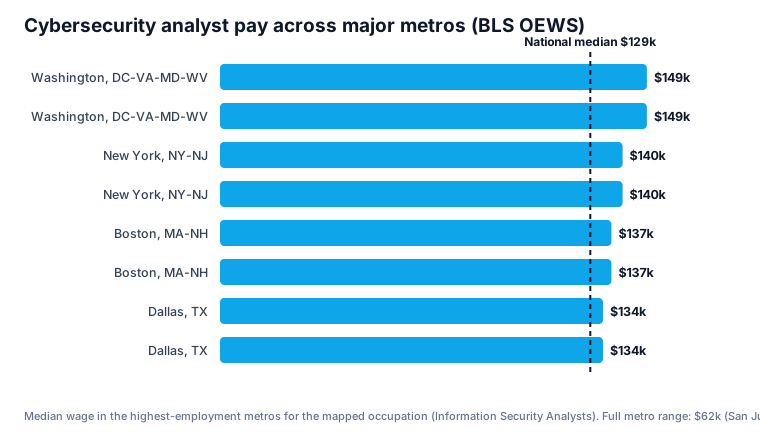
Tech salary varies enormously by location — the same occupation's metro median can range nearly 3x (cybersecurity runs from about $62,490 in the San Juan, PR metro to $176,120 in San Jose, versus a $129,180 national median, BLS OEWS May 2025) — but high-pay metros also carry high living costs, so a bigger number isn't automatically more money in your pocket. Where you live moves your tech paycheck more than almost anything except your years of experience — and a single national salary number hides all of it. Using cited BLS OEWS data (May 2025) for the occupations our entry roles map to, here's the honest geographic picture: how wide the spread really is, where the jobs actually are versus where they pay most, and the cost-of-living catch that the "just move to San Jose" advice ignores. We don't sell you anything, and our recommendations are never influenced by who pays us.
Key takeaways
- Location can move a tech salary nearly 3x: cybersecurity runs from about $62,490 (San Juan, PR metro — reflecting Puerto Rico's lower overall wage level) to $176,120 (San Jose) vs. a $129,180 national median (BLS OEWS, May 2025).
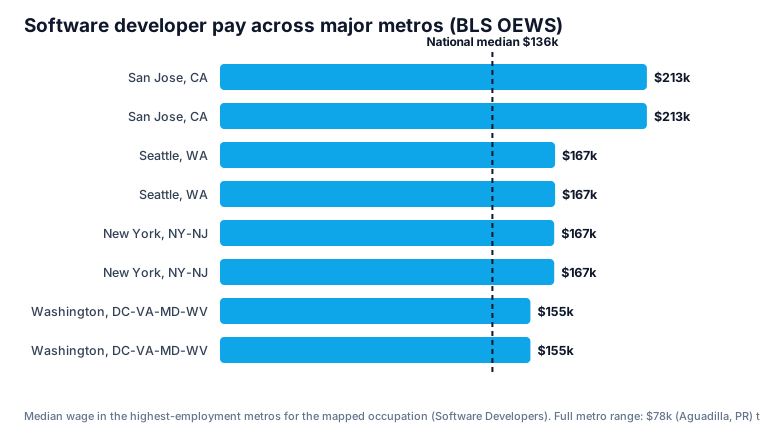
- The largest job markets aren't always the highest-paying — for software developers, New York and Seattle are among the biggest employment markets, but San Jose pays the most ($213,110).
- High-pay metros carry high living costs; weigh any big-city salary against its cost of living before treating it as more money.
- Location and career stage both move pay — IT support spans about $30,090 (Ponce, PR metro) to $106,040 (Sacramento), with a $40,980 national 10th percentile. Every figure is occupation-level context, not a guarantee.
The same job, very different paychecks
Take cybersecurity. The national median is $129,180 — but in the San Jose metro the median for that occupation is $176,120, while in the San Juan, Puerto Rico metro it's about $62,490. That's nearly a 3x range — though the low end reflects Puerto Rico's much lower overall wage and price level, not location opportunity alone, so it overstates the pure take-home difference. Even across mainland metros, though, the spread is wide: the chart shows the highest-employment markets against the national-median line, and they range well above and below it.
| Metro | Cybersecurity | Software developer | IT support |
|---|---|---|---|
| National median | $129,180 | $135,980 | $61,860 |
| San Jose, CA | $176,120 | $213,110 | $93,590 |
| San Francisco, CA | $162,310 | $186,640 | $89,440 |
| Seattle, WA | $161,780 | $167,280 | $78,330 |
| Washington, DC | $148,950 | $154,930 | $77,860 |
| New York, NY | $140,470 | $166,830 | $75,690 |
| Austin, TX | $134,100 | $134,120 | $61,990 |
| Dallas, TX | $133,610 | $133,290 | $60,710 |
Every cell is a cited BLS OEWS (May 2025) metro median for the mapped occupation. Even across mainland metros the spread is wide — cybersecurity runs from about $133,610 (Dallas) to $176,120 (San Jose); the near-3x figure appears only once you include lower-wage US territories like Puerto Rico. Across the 382 metros BLS reports for software developers alone, medians span roughly $78,000 to $213,110.
Where the jobs are isn't always where they pay most
Two different questions hide behind "where should I work": where are the most jobs, and where do they pay most? They don't have the same answer. For software developers, the highest-employment metros include New York ($166,830 median) and Seattle ($167,280), but the highest-paying is San Jose at $213,110 — versus a $135,980 national median. The biggest job market and the biggest paycheck are often different cities, so weigh both your odds of landing a role and the pay, not just one.
The cost-of-living catch
A bigger salary in a high-cost metro is not automatically more money in your pocket. The metros that top these wage charts — the Bay Area, Seattle, New York — also carry some of the highest housing and living costs in the country, which can erase much of the nominal advantage. We don't publish a cost-of-living index (we only show figures we can cite), so before you anchor on a high-metro number, check a cost-of-living comparison for that specific city and weigh the salary against it. Depending on the cost gap, a lower nominal salary in a mid-cost metro can leave you with more take-home than a higher one in the Bay Area — but whether that's true for any two cities depends on costs you'll need to look up yourself. A concrete way to do it: divide a metro's median by its BEA Regional Price Parity — a free, official cost-of-living index from the U.S. Bureau of Economic Analysis. If a metro pays a $150,000 median but its price parity is 1.15 (15% above the national average), that is roughly $130,000 in national-dollar buying power. A bigger number in an expensive metro isn't automatically more money in your pocket.
Location and career stage both move the number
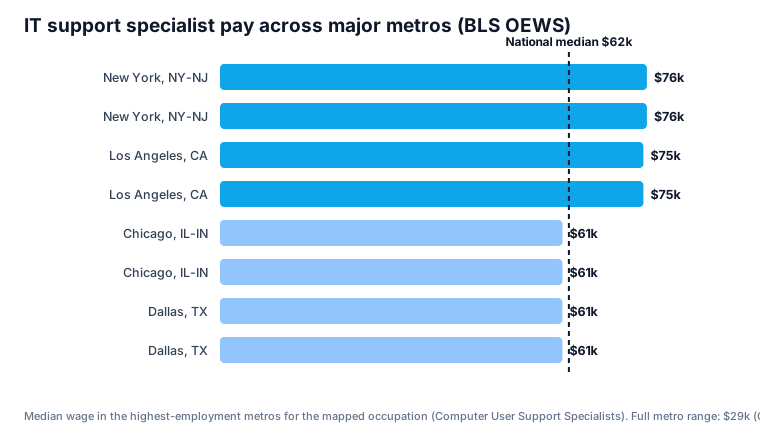
Geography is only half the story; where you sit in the experience distribution is the other half. IT support shows both at once: the national median is $61,860, it reaches about $106,040 in the Sacramento metro, and it falls to about $30,090 in the Ponce, Puerto Rico metro (again reflecting that territory's far lower overall wage and price level) — while nationally the 10th percentile, a realistic early-career figure, is just $40,980. So a career changer's actual starting pay depends on their metro and their spot in the distribution together. Read both, not the single headline median.
How to use location data honestly
Three rules. First, check the figure for your actual metro, not the national median — the difference can be tens of thousands of dollars. Second, weigh any high-metro salary against that metro's cost of living before treating it as a win. Third, remember remote work increasingly blurs the map: some employers pay a national rate regardless of location, others adjust by geography, so confirm a given employer's policy rather than assuming. Used together, these cited location figures are a planning tool — not a promise, since every number here is occupation-level BLS context, not your guaranteed pay.
Frequently asked questions
Do tech jobs pay more in some cities?
Yes — substantially. For the same occupation, metro medians can differ by 2–3x. Cybersecurity, for example, has a median near $176,120 in San Jose versus about $62,490 in the San Juan, Puerto Rico metro (where the territory's lower overall wage level widens that particular gap), against a $129,180 national median (BLS OEWS, May 2025).
Where do tech jobs pay the most?
By cited median wage, the highest-paying metros for several tech occupations are in the Bay Area (San Jose, San Francisco) and Seattle — for instance, software developers reach a $213,110 median in San Jose. But those metros also have the highest living costs, so the nominal figure isn't the whole picture.
Should I move to a high-paying tech city?
Not automatically. A higher salary in an expensive metro can leave you with less after housing than a smaller salary in a mid-cost city. Compare the cited wage against that metro's cost of living, and factor in whether remote work lets you earn a high-metro rate from a lower-cost area.
Does remote work change tech salaries by location?
It can blur them. Some employers pay a single national rate regardless of where you live; others adjust pay by your location. There's no universal rule, so confirm a specific employer's remote-pay policy rather than assuming the local metro figure applies.
How much does location change an entry-level tech salary?
A lot — often more than your job title. IT support, for example, spans about $30,090 in its lowest-paying metros (in Puerto Rico, which has a much lower overall wage level) to about $106,040 in Sacramento, and nationally starts near a $40,980 10th percentile. Always check your own metro, and read it as occupation-level context, not a personal guarantee.
Related, with the cited detail
- How much do tech jobs actually pay?
- Compare entry paths on cited pay and outlook
- The cited cybersecurity salary detail
- Compare every route into tech
- Ways to fund your path
- Start the RoleMath planner
Sources
Figures in this article trace to official sources — BLS OEWS (May 2025) and Employment Projections (2024–2034), O*NET, and OEM certification pages — named where they appear or on the cited page each links to. Charts are drawn from those cited BLS figures, with the source noted in each caption.
Citation Ledger
| ID | Supports | Evidence | Source |
|---|---|---|---|
| CIT-01 | Visible figures and claims | Official sources (BLS OEWS May 2025; BLS Employment Projections 2024–2034; O*NET; OEM certification pages) | Named inline and on each linked cited page |